The Next 100 Things You Need To Know About People: #106 — People Prefer Objects With Curves

Do people prefer logos with curves rather than logos with interesting angles? Have you noticed that your favorite smartphones, tablets, and laptops tend to have rounded corners?People prefer objects with curves—a preference that’s evident even in brain scans. This field of study is called neuroaesthetics.

Bar and Neta showed concrete and abstract images with and without curves to people, for example, the images below:

Moshe diagram
Moshe diagram (http://barlab.mgh.harvard.edu/publications.htm)

People gave higher “liking” ratings to the objects with curves. Bar and Neta’s theory was that the sharp and angled images conveyed a sense of threat.

What about complex shapes? Silvia and Baron tested complex, angular shapes and complex shapes with slightly curved edges. Again, people preferred the objects with curves.

Helmut Leder Pablo Tinio and Bar (2011) asked whether this preference for curves was true for both “positive” objects (birthday cakes and teddy bears) and “negative”objects (razor blades and spiders). The results? People preferred curves in objects that were either positive or neutral, but there was no preference for curves in negative objects.

Curves stimulate the brain — Ed Connor and Neeraja Balachander took this idea into a neuroimaging lab.  Not only did people prefer rounded shapes, there was more brain activity in the visual cortex when they viewed shapes that were more curved and more rounded.

Takeaways:

  • People prefer curves
  • If you’re creating a logo, incorporate some form of curve in the design
  • If you’re creating areas of color on a screen, consider using a “swoosh” or curved shape
  • If you’re designing actual products – such as smartphones, remote controls, medical devices, or other hand-held items – used curved surfaces.

Nike, Apple, Pepsi, Coca-Cola and dozens of other well-known brands use one or more curves in their logos. Did they fall into curves or did they do their homework?

Here are the research references:

Bar, Moshe, and Maital Neta. 2006. “Humans prefer curved visual objects.” Psychological Science. 17(8): 645-648.

Leder, Helmut, P.P.L. Tinio, and M. Bar. 2011. “Emotional valence modulates the preference for curved objects.” Perception. 40, 649-655.

If you liked this article, and want more info like it, check out my newest book: 100 MORE Things Every Designer Needs To Know About People. 


The Next 100 Things You Need To Know About People: #103 — Beauty Is In The Eye Of The Beholder’s Age, Gender, And Geography

Which of these search engine home pages do you find most visually appealing?:


Picture of Google Home page


Picture of Naver.com home page


Naver.com is the search engine for South Korea. Google is the search engine for lots of other places. Whether you found the Google design more visually appealing or whether you found the Naver design more visually appealing has a lot to do with how old you are, whether you’re a woman or a man, and where you live.

Katharina Reinecke and Krzysztof Gajos researched different visual designs around the world, with men and women of different ages. Here’s what they found:

  • People over 40 preferred more colorful designs compared to younger people. This preference was even stronger among people over 50.
  • Across all ages, women preferred websites that were more colorful than men did.
  • Men preferred websites with a gray or white background and some saturated primary colors.
  • Women preferred color schemes with fewer contrasting colors.
  • People from Finland, Russia, and Poland liked websites without a lot of colors. People from Malaysia, Chile, and Macedonia preferred websites with a lot of color.
  • People from countries near each other tended to like the same amount of colors. For example, Northern European countries didn’t like a lot of colors.
  • People in English-speaking countries preferred more color than those in Northern European countries.

Takeaways

  • If your target audience is primarily men, consider a white or gray background with a contrasting color.
  • If your target audience is primarily women, consider using more color, but fewer contrasting colors.
  • When you’re designing for a specific geographical area, make sure you’re familiar with the color and visual design preferences for that region.
  • Test your visual design with your target audience.
  • When you’re designing for a geographic area that you’re unfamiliar with, be sure to have someone FROM that area working with you

Here’s the reference for the research:

Reinecke, Katharina, and Gajos Krzysztof. 2014. “Quantifying Visual Preferences around the World.” Proceedings of the 33rd Annual ACM Conference on Human Factors in Computing Systems.

This post is from my newest book: 100 MORE Things Every Designer Needs To Know About People.

The Neuro-Aesthetics of Hillary’s Campaign Logo

logo for Hillary campaign
hillaryclinton.com

Yesterday Hillary Clinton announced her candidacy for President of the US, and before 24 hours went by I had a media request to talk about why people were reacting so strongly (in a negative way) to her logo.

I’m in the middle of writing my next book (100 MORE Things Every Designer Needs to Know About People) and I’ve just sent in the chapter on Visual Design which contains some new research on neuro-aesthetics — how our brain reacts to certain visual design elements.

Based on the research, here’s the brain science behind the vitriol:

People prefer objects with curves and you can even “see” the preference in brain scans. This field of study is called neuroaesthetics.

Moshe Bar (Director of the Cognitive Neurosciences Laboratory at Massachusetts General Hospital) and his team used images of everyday and abstract objects to see if people have a preference for objects with curves. In one of their early studies Moshe Bar and Maital Neta (2006) showed 140 pairs of objects. Some were concrete objects such as watches or couches (the A objects in the picture below), some were abstract objects (the B objects) and some of the objects had both curves and edges. These last objects acted as baseline controls (the C objects).

pictures of curved and angular objectsPeople gave higher “liking” ratings for the objects that had curves. Bar and Neta’s theory was that the sharp and angled images would convey a sense of threat.

Ed Connor and Neeraja Balachander took this idea into a neuro imaging lab. They took an abstract shape similar to the shape on the left in the picture below and then made a series of similar but elongated shapes as shown in the rest of the picture below.

picture of rounded and elongated shapes

Not only did people prefer the softly rounded shape like the one on the left — there was more brain activity in the visual cortex with shapes that were more curved and more rounded.

We could talk about the problems with red and blue on top of each other, which produces chromostereopsis too. I’ve got another blog post about that.

But from a brain science point of view, the main reason Hillary’s logo is getting a lot of negative comments?: NO CURVES!

If you’re interested in the research I’ve got some references below, and check out 100 MORE Things Every Designer Needs to Know About People  the new book which will be out in October of 2015 and is available for pre-order!

What do you think? No curves? Chromostereopsis? Something else?

References:

Bar, M., & Neta, M. (2006). Humans prefer curved visual objects. Psychological Science, 17(8), 645-648.

H. Leder, P.P.L. Tinio, and M. Bar (2011) Emotional valence modulates the preference for curved objects. Perception, 40, 649-655.

Paul J. Silvia and Christopher M. Barona, “Do People Prefer Curved Objects? Angularity, Expertise, and Aesthetic Preference”, Empirical Studies of the Arts 01/2009; 27(1):25-42.

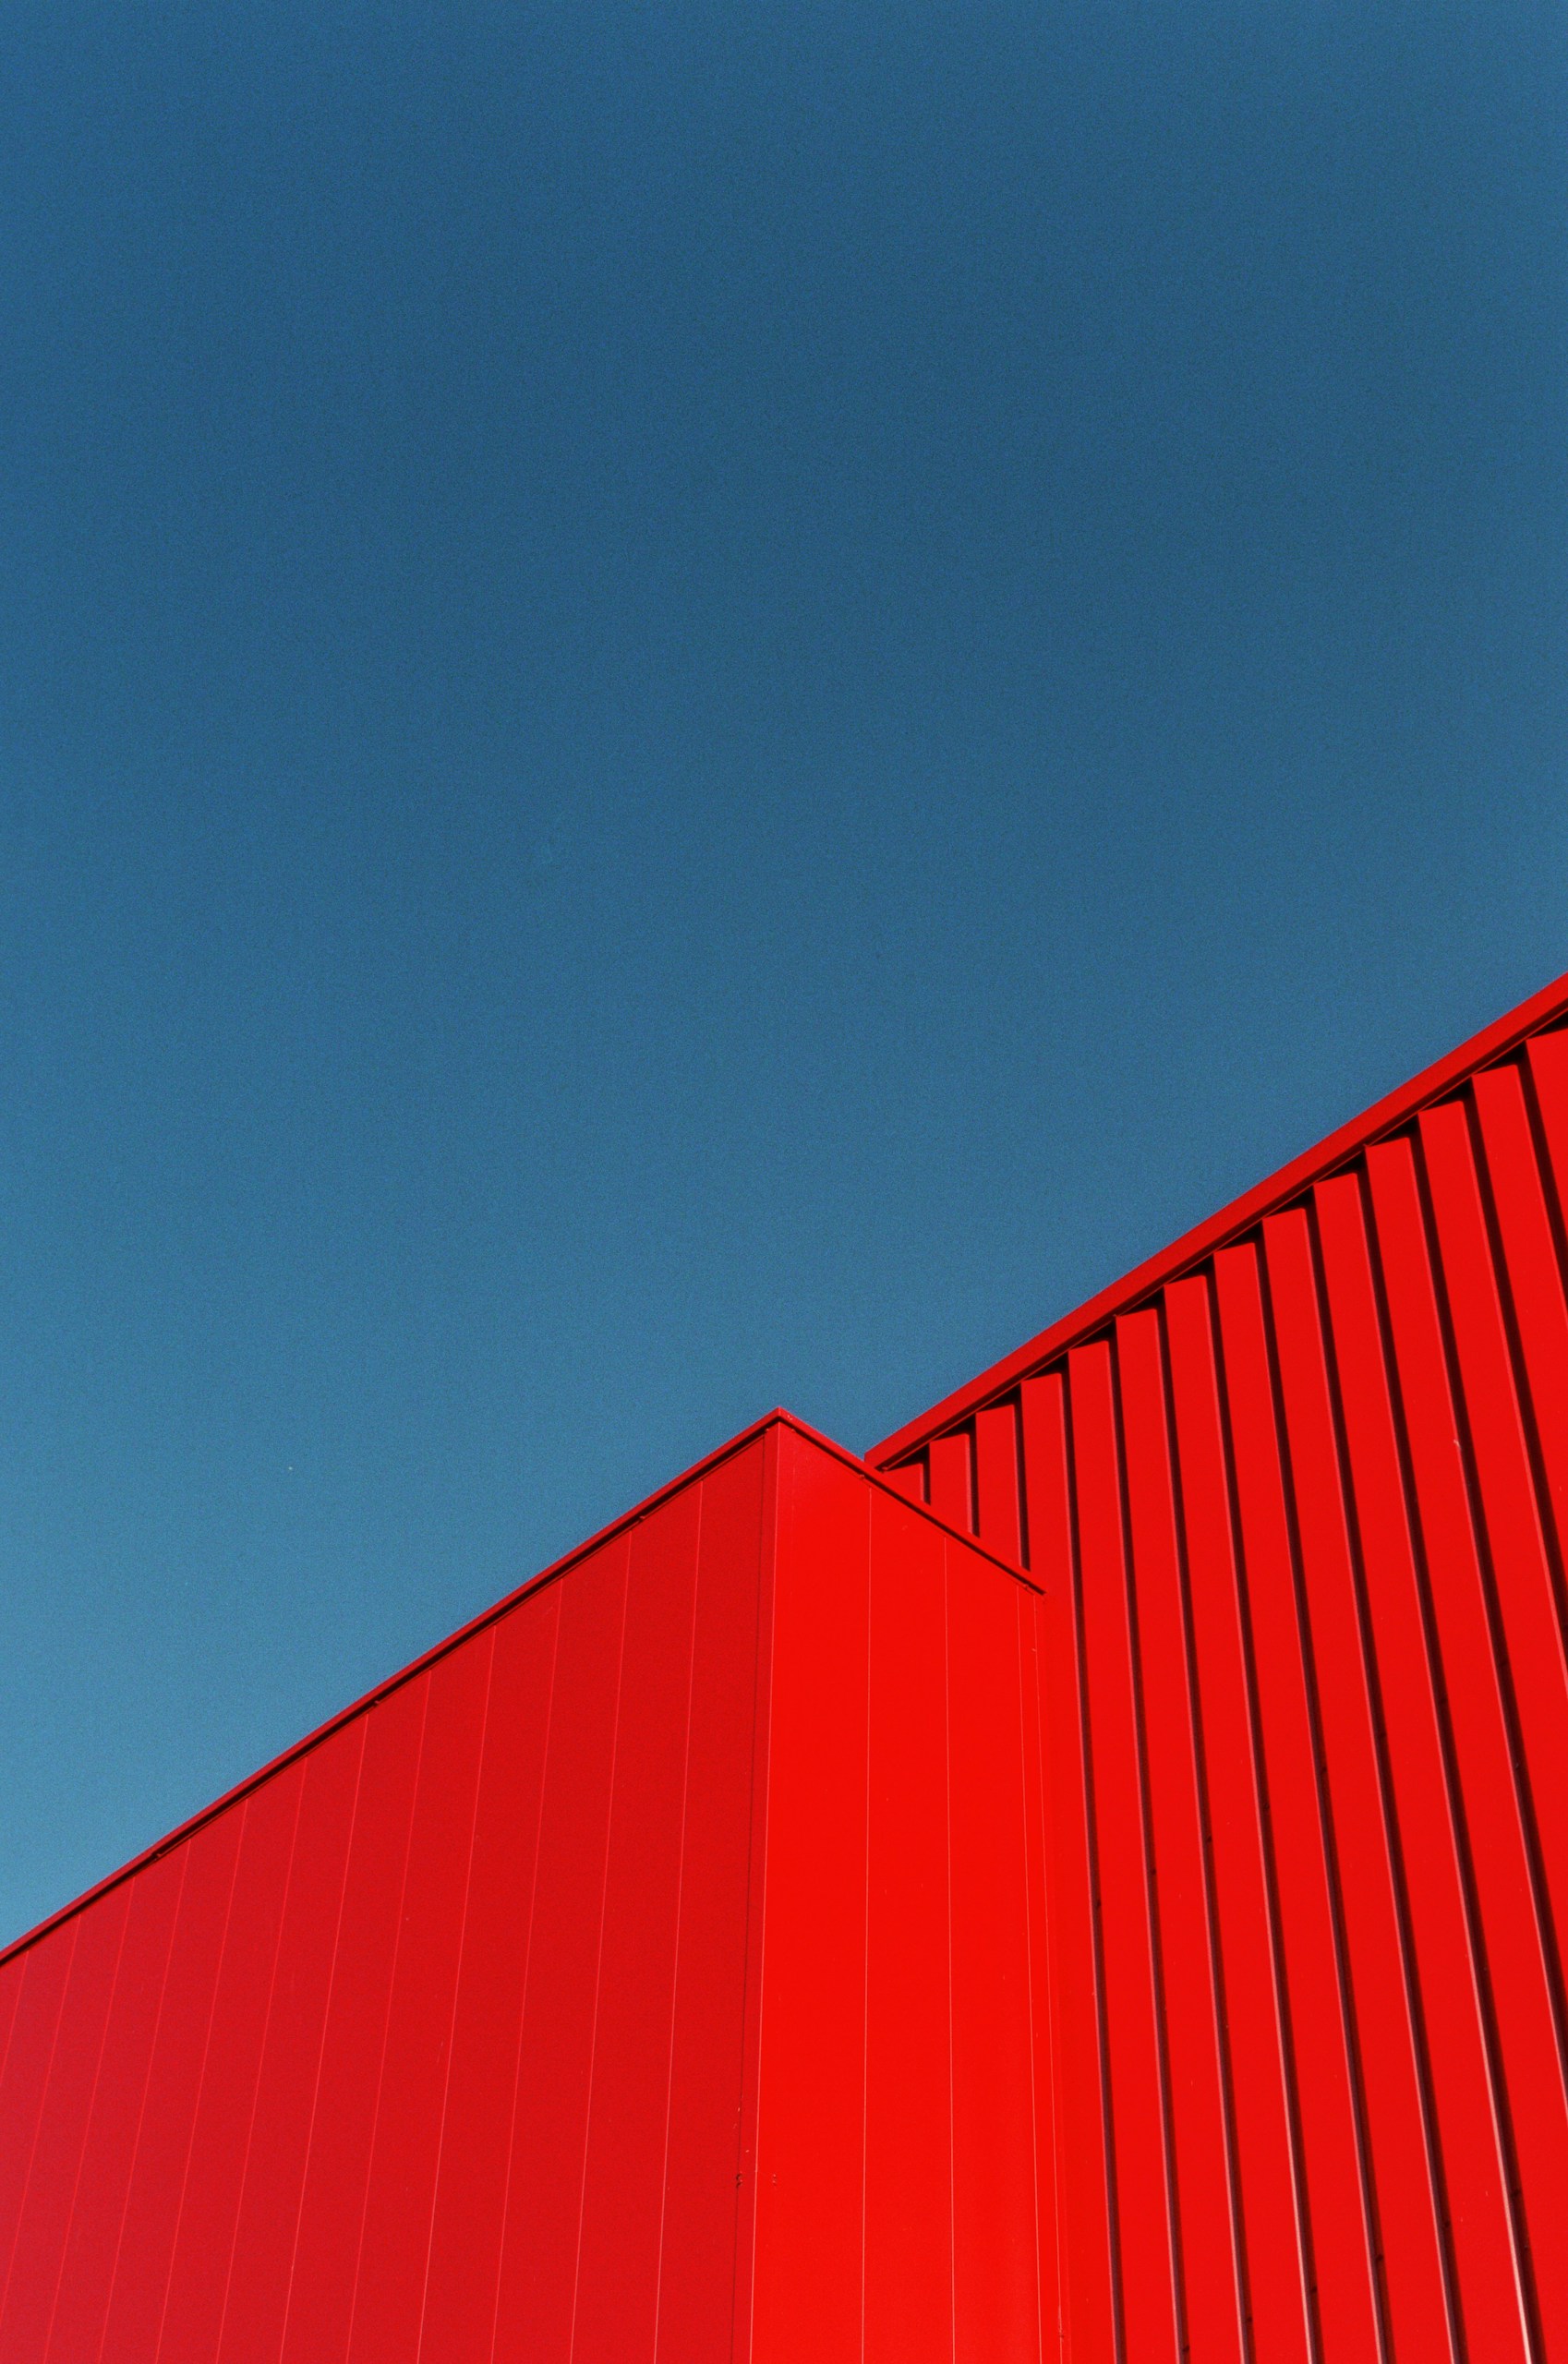
Red Or Blue?: Research On Screen Color That May Surprise You

a red square and a blue squareHow does color affect our behavior when we are doing things online? Does it make a difference what the color background is? Does it depend on what we are reading or doing? Can you affect people’s decisions and behavior by changing the background color of a particular page or screen?

Research by Ravi Mehta and Rui Juliet Zhu from the Sauder School of Business at the University of British Columbia looks at these questions. In a fairly comprehensive set of different studies Mehta and Zhu found some interesting color effects. I describe the six studies below (but if you can’t wait for the punchline skip down to the “take-aways” section).

STUDY 1

In the first study people were first given anagrams to solve. Some of the anagrams used “avoidance” words, for example ‘prevent’, some of the words were “approach” words, for example ‘adventure’, and some were “neutral”, for example, ‘computer’.  Sometimes the words were on a red background and sometimes on a blue background. People solved the avoidance words faster when they were on a red background (compared to blue or neutral) and they solved the approach words faster when they were on a blue background (compared to red or neutral).

The second task in this study had people read brand descriptions and then rate each brand on a scale from 1 to 7. Some of the brand descriptions had a message of a negative outcome you would want to avoid – for example a toothpaste that would prevent cavities. Others had messages of approach – for example a toothpaste that whitens your teeth. When the brands were on a blue background people preferred brands that were described with the approach or positive description. When the brands were on a red background people preferred the brands that had avoidance messages.

STUDY 2

In the second study people were given a “detailed” task — memorizing words. They were given 36 words to memorize in 2 minutes. Then they were asked to recall the words 20 minutes later. For some people the background screen was red, others blue and others neutral. People who did the task with the red screen remembered more words correctly than people with the blue or neutral background. People with the blue background would remember as many words as red, but several of the remembered words were actually false (i.e., they were not in the set of words originally memorized).

In the second part of study 2 people completed a “creative” task – they were asked to come up with as many creative uses for a brick as they could in 1 minute. A panel of judges rated how creative the list was. Some of the people worked on a red screen, others blue, and others neutral. The color didn’t affect how many ideas people came up with, but people working with a blue screen had more creative solutions than those in the red or neutral.

STUDY 3

In Study 3 people were asked to read sets of names or addresses which were either identical or were slightly different. It was a proofreading task. The participants had to decide whether one name and address matched another. Some people did the task on a blue screen, others on red and others on a neutral color. The participants were also asked afterwards whether they were focusing on avoiding mistakes or going quickly. People working with a red screen were more accurate on the task than people working on a blue or neutral screen. People working on a red screen also were more likely to report that they were trying to avoid mistakes.

STUDY 4

In Study 4 people were given a sheet of paper with drawings of different parts. They were asked to use any five parts and use them to design a toy that someone age 5 to 11 would play with. The parts were printed in either red or blue. Judges (using black and white copies of the design) then rated the designs based on originality and novelty (creativity) vs. practicality and appropriateness (attention to detail). Red toys were judged to be more practical and appropriate than blue. Blue toys were judged to be more original and novel.

STUDY 5

In study 5 people were shown ads for a camera on a computer screen. The ad was presented with a background color of either red or blue. In some versions of the ad there were pictures that showed product details of the camera, for example the lens. Other versions included visuals that were not about the camera, for example, a road sign,  or a map, which would use creative thinking to connect the camera to a road trip. Participants rated the ads for their appeal and effectiveness. When the screen was red people rated the ad more highly when it included the specific product detail visuals. When the screen was blue then people rated the ad more favorably when the visuals were more conceptual.

STUDY 6

In study 6 people were given tasks in black font on a white background screen. They were told that one of the tasks required detailed and careful processing of information and that another would require creative, imaginative and “out of the box” thinking. They were asked to select which color, red or blue, they thought would enhance their performance on each task. People picked blue for BOTH tasks, i.e., they believed that blue would enhance their performance no matter what the task.

Here are my take-aways from this research:

  • If you are using a negative or fear message it will be more impactful if you use the color red. If you are using a positive message then use blue.
  • If you want people to do a detail-oriented task use a red background. If you want them to be creative use a blue background.
  • If you are highlighting detailed features of a product your message will be more persuasive if you use a red background. If you are highlighting concepts of how to use the product then the message will be more persuasive with a blue background.
  • People prefer blue backgrounds over red, even though red might make them get a task done more quickly. They are not aware of the effects that the colors are having.

IMPORTANT NOTE: These studies were all done in North America. There are cultural effects of color, so these results may NOT hold in different parts of the world.

What do you think? Are you willing to use red?

And if you like to read the research:

Ravi Mehta and Rui (Juliet) ZhuBlue or Red? Exploring the Effect of Color on Cognitive Task Performances. Sauder School of Business, University of British Columbia, 2053 Main Mall, Vancouver, BC V6T 1Z2, Canada. www.sciencexpress.org / 5 February 2009 / Page 1 / 10.1126/science.1169144


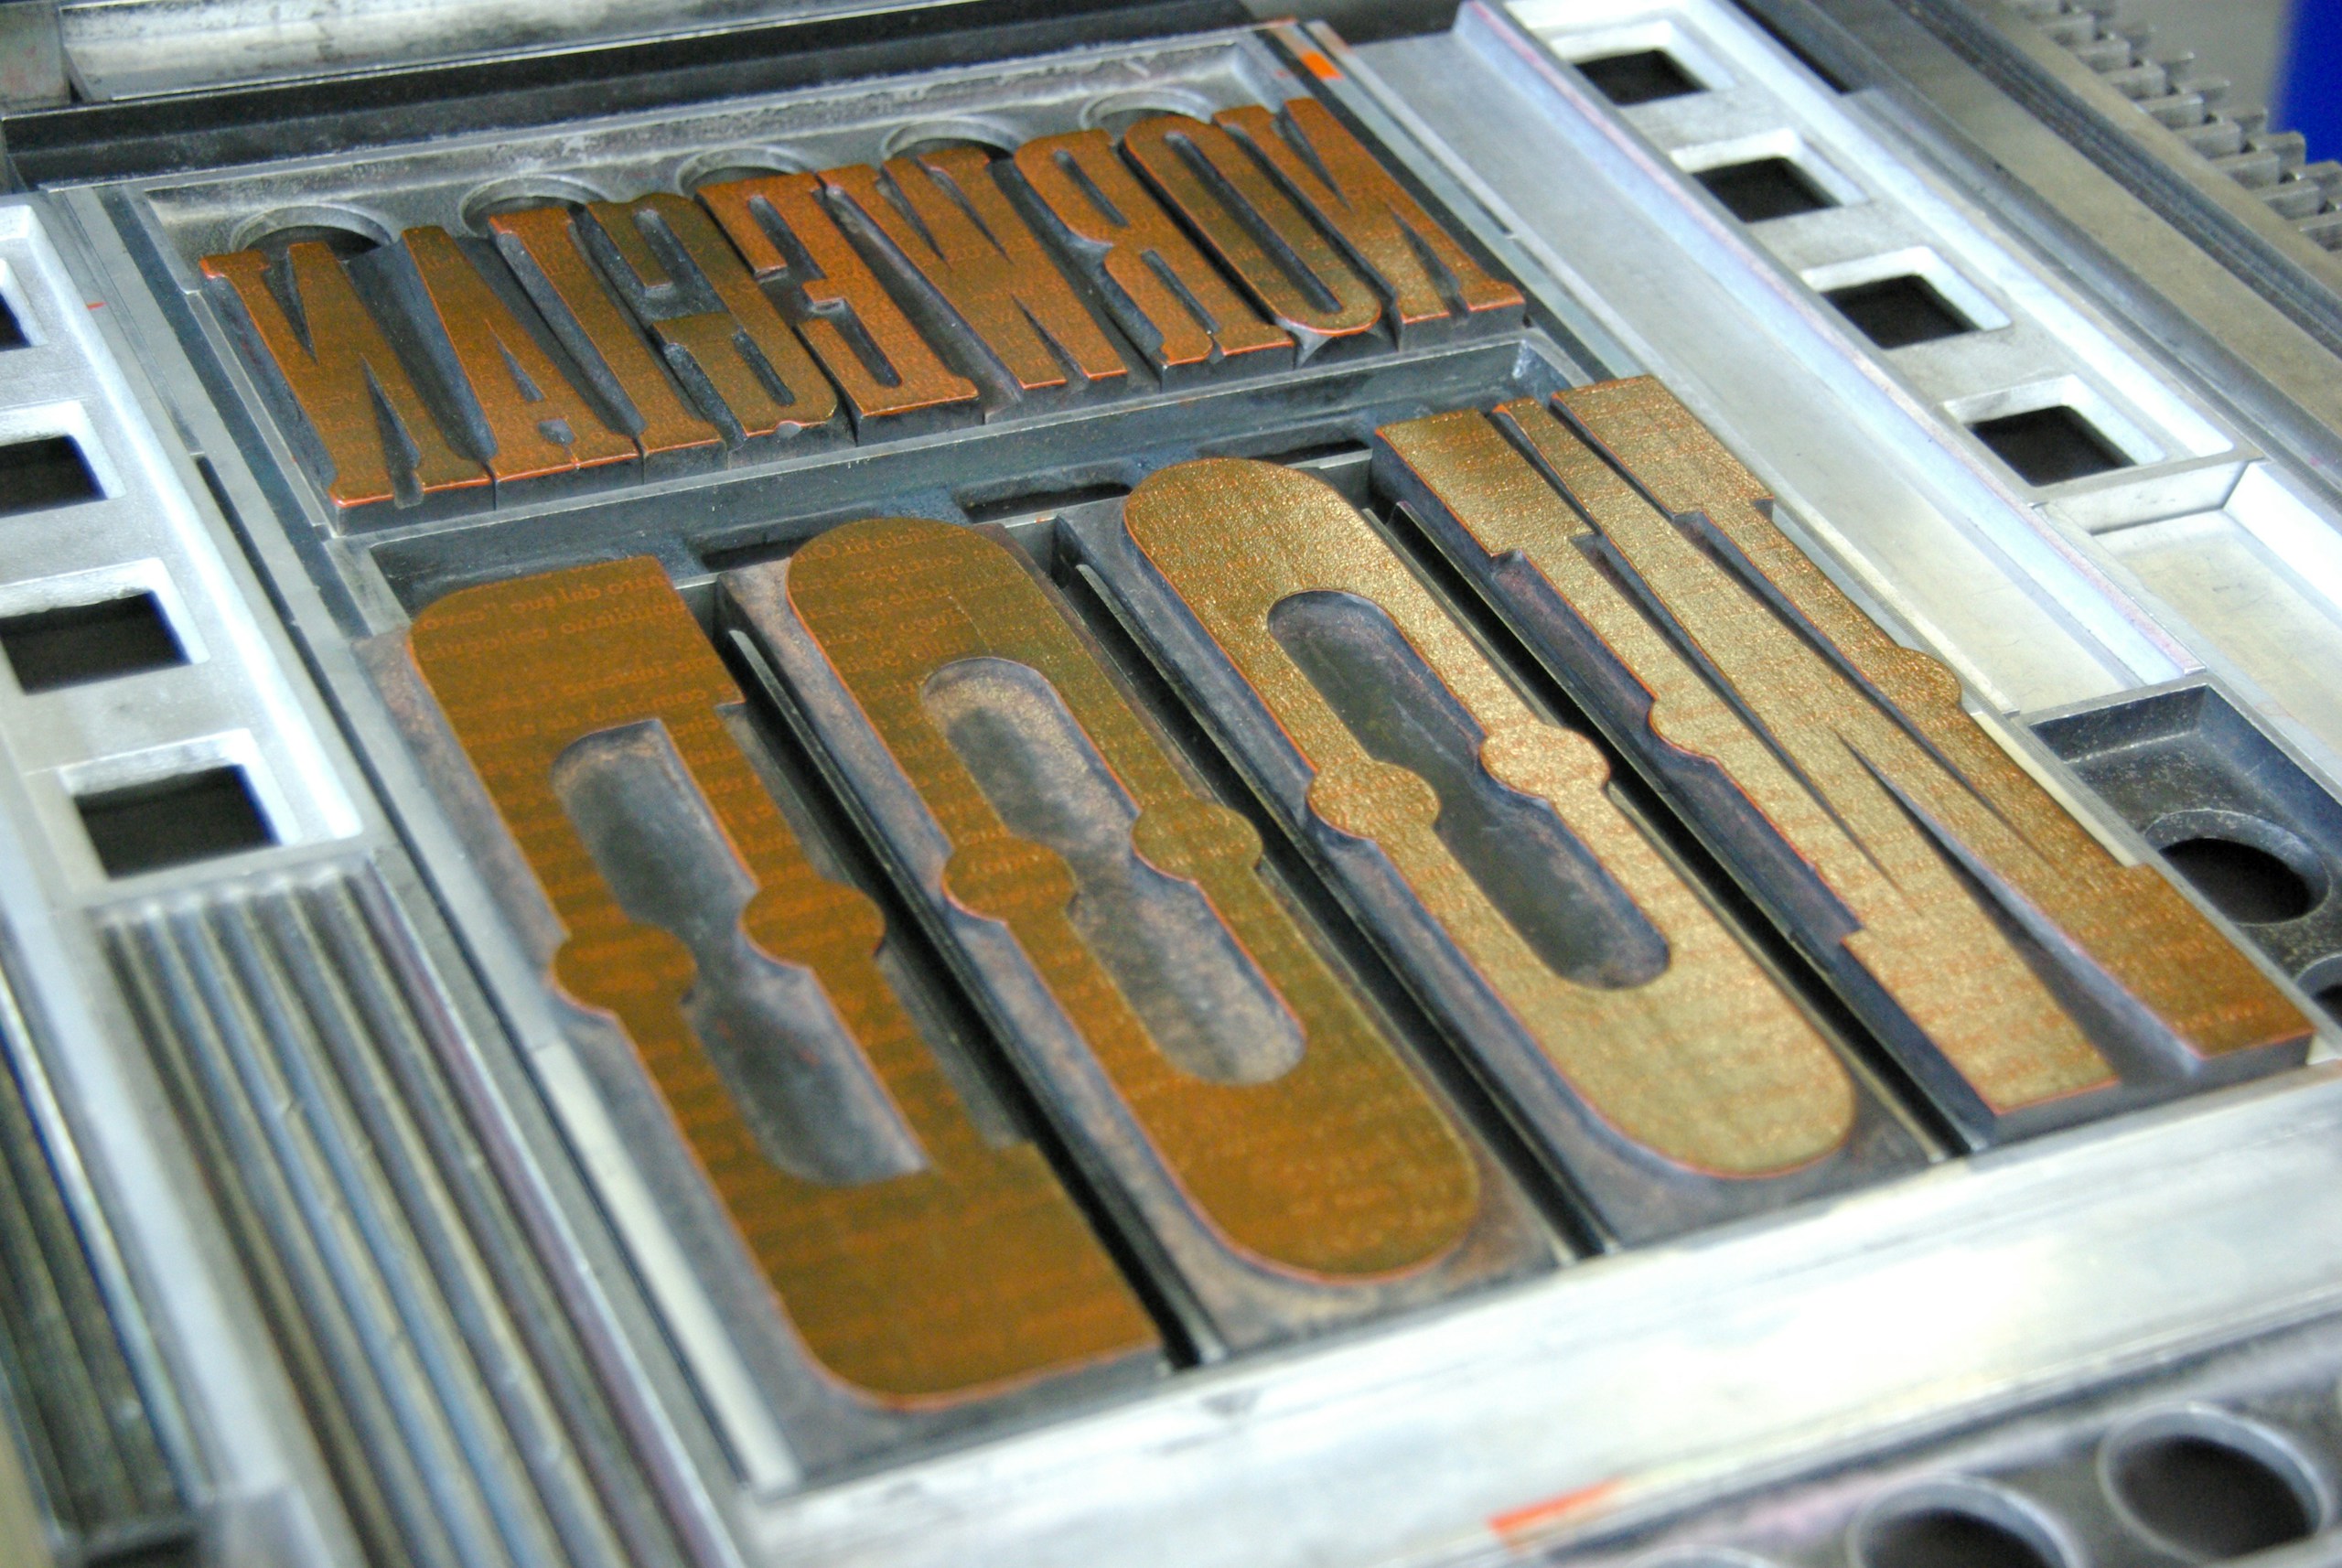
How To Get People To Do Stuff: #3 — A Hard-To-Read Font Will Activate Logical Thinking

I am taking a chance here, because I know that the subject of fonts is always controversial, and if I say that you should use fonts that are hard to read I’ll be blasted by many of my readers! But I have to share this fascinating research on how mental processing changes in some surprising ways when people read text that is in a hard to read font vs. an easy to read font. Below is the video.

For more information check out:

Daniel Kahneman’s book Thinking Fast And Slow

and my new book (when it comes out in March 2013 — available for pre-order now at Amazon) How To Get People To Do Stuff

In a previous video on confirmation bias I talk about Daniel Kahneman’s idea of System 1 (quick, intuitive) thinking vs. System 2 thinking (slow, logical, analytical). Kahneman’s research shows that when a font is easy to read then System 1 thinking does its usual thing — makes quick decisions, which are not always accurate. When a font is harder to read, System 1 gives up and System 2 takes over. Which means that people will think harder and more analytically when a font is hard to read. I’m NOT suggesting you intentionally make fonts hard to read in the text you have at websites and in other places, but these findings do make me pause and think about whether we are all inadvertently or purposely encouraging people not to think about what they are reading.

Ok, let’s hear it! I know you will all want to weigh in on this one!

100 Things You Should Know About People: #96 — Past Experience And Expectations Determine Where People Look

Sign that says "Look Here"Where do people look first on a computer screen? Where do they look next? It depends partially on what they are doing and expecting.

Left to right? — If people read in languages that move from left to right, then they tend to look at the screen from left to right. If they read from right to left, it is the opposite.

Not the edges — People tend to ignore the edges of screens. Because people have gotten used to the idea that there are things on computer screens that are not as relevant to the task at hand, such as logos, blank space, and navigation bars,  they tend to move towards the center of the screen and avoid the edges. After the first look at a screen people then move in whatever is their normal reading pattern, in other words left to right/top to bottom in cultures that read that way.

Grabbing attention — If there is something that grabs attention, for example, a large photo (especially one with someone’s face), or movement (animated banner, video) somewhere else on the screen, then you can pull them away from their normal reading path and get them to look elsewhere, at least briefly.

Where to find certain tools and features — People have also gotten used to the location of certain items on a screen. For example, navigation bars are usually on the left or the top. Logos are at the top left. Search is expected at the top, either in the middle or towards the right. Help links or buttons are usually at the top right.

What do you think? Is it important to design with these conventions in mind? Or do you sometimes break out of the mold?


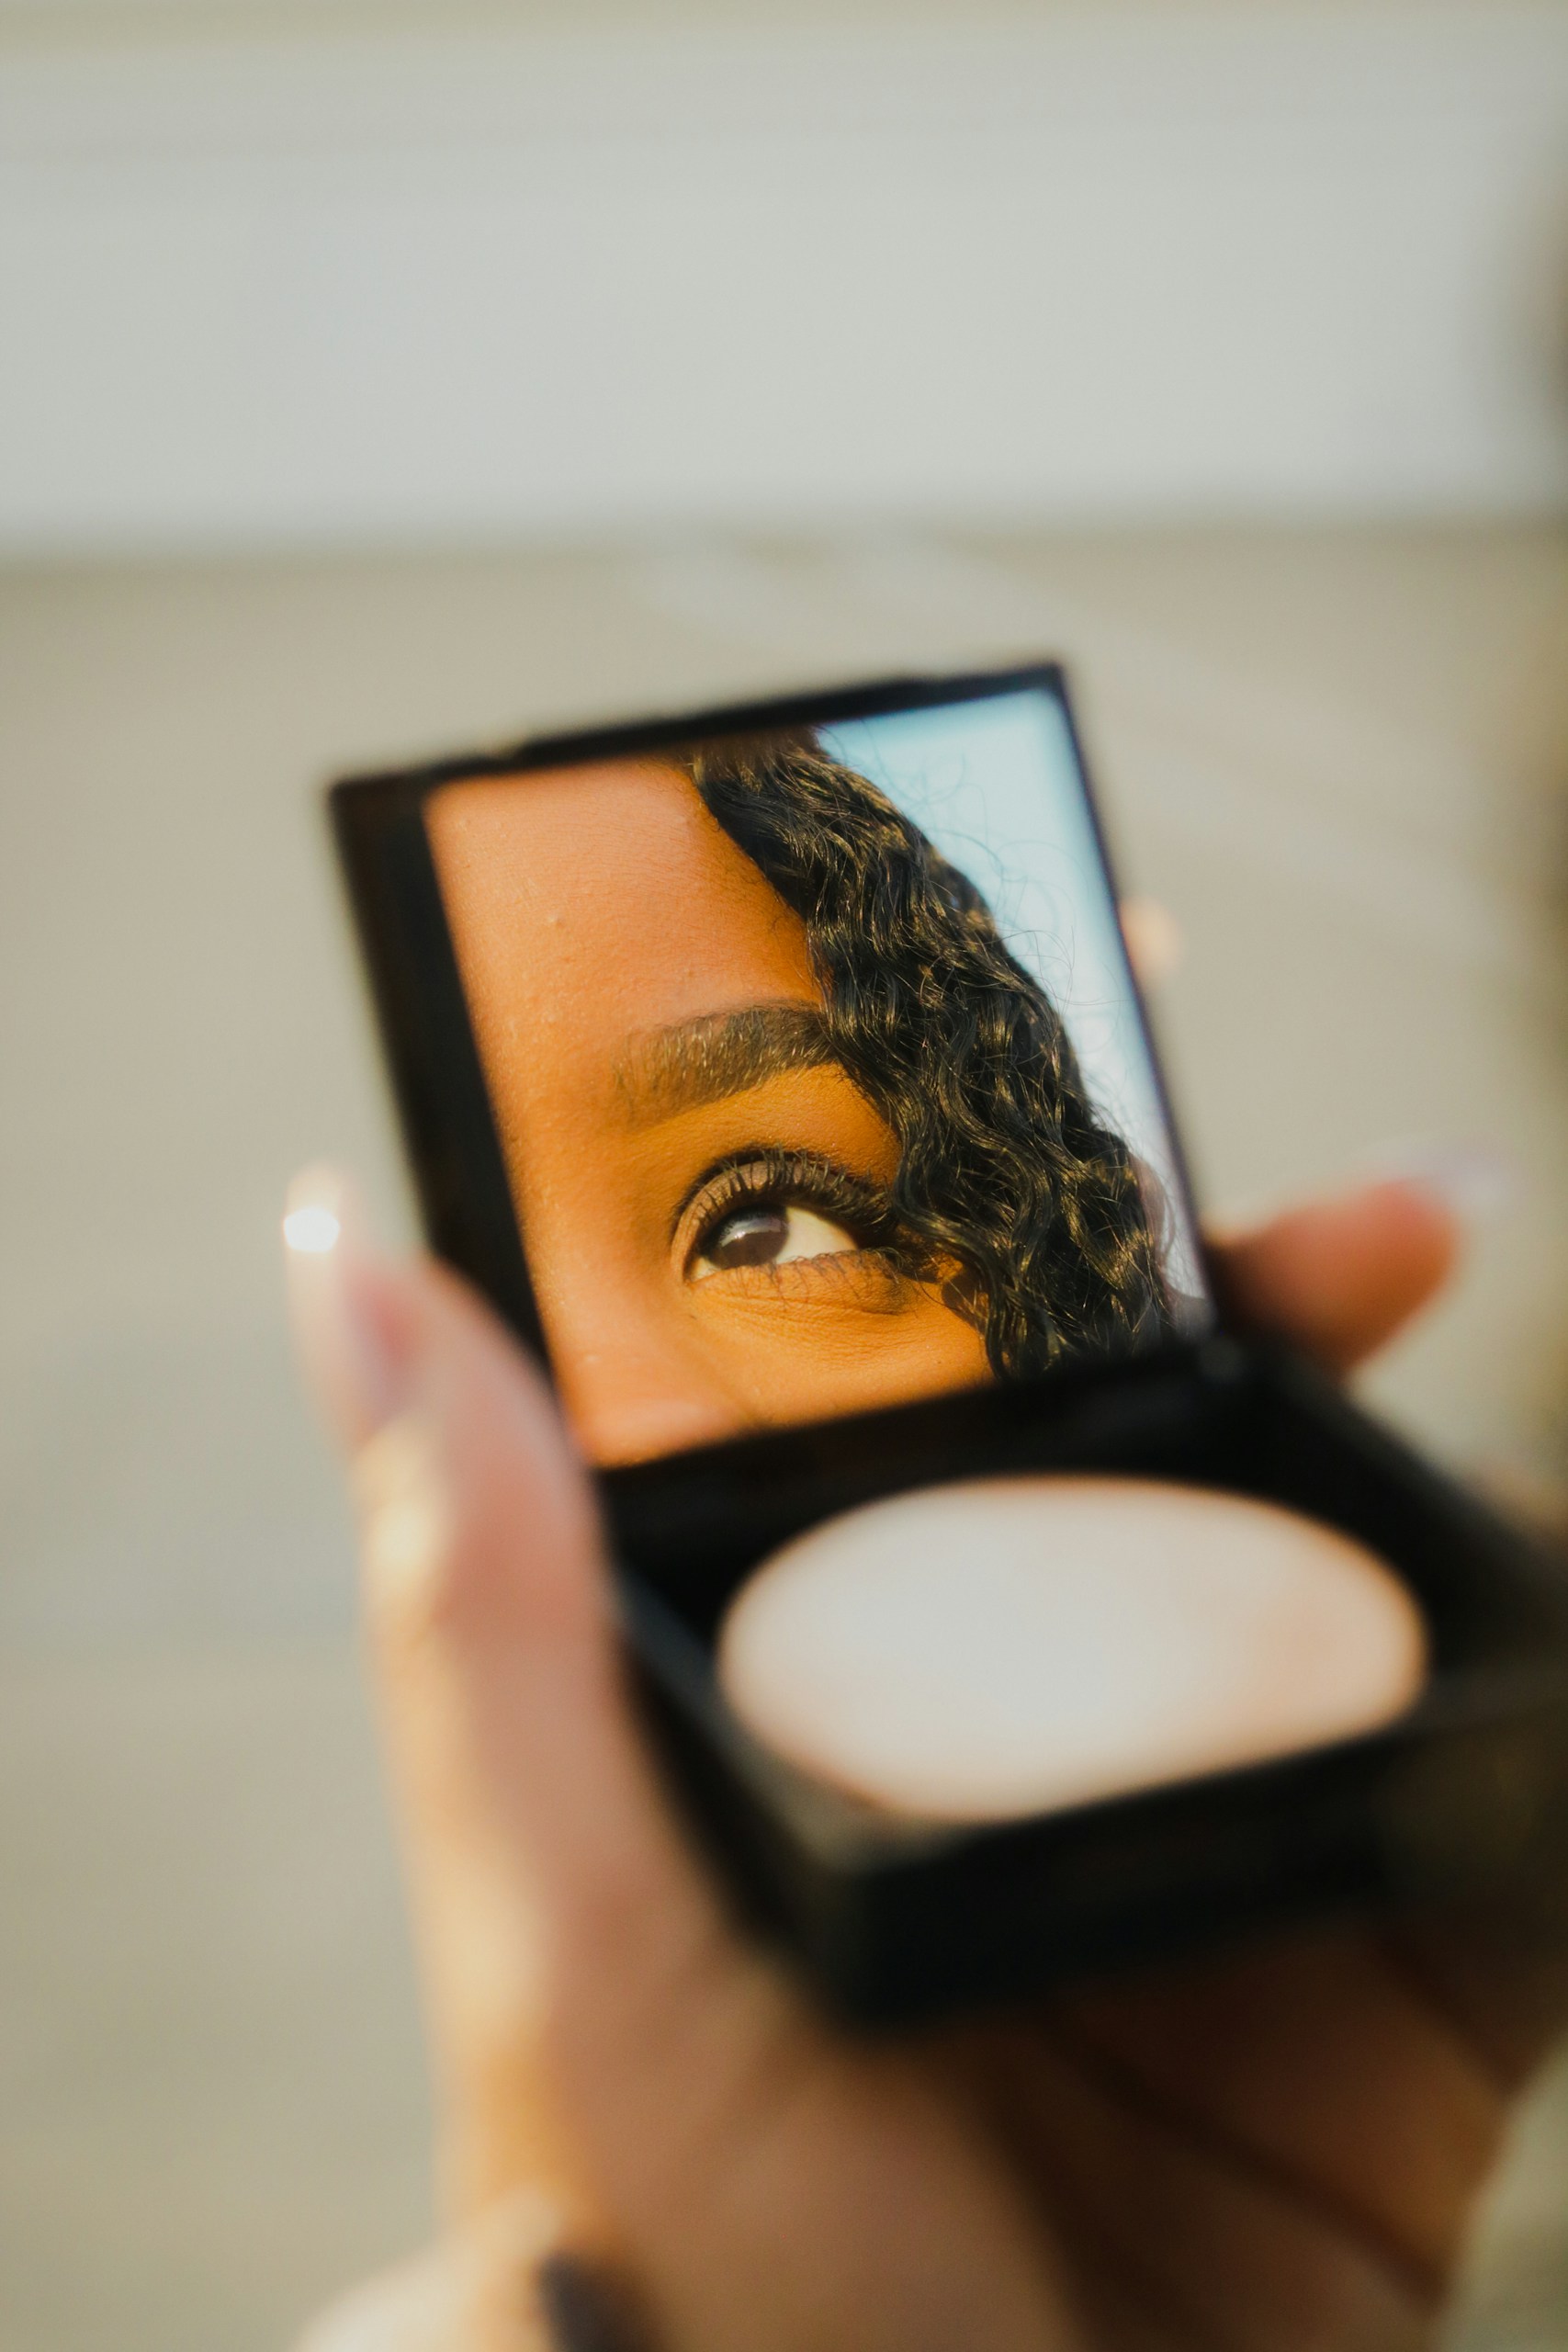
100 Things You Should Know About People: #92 — There Is A Brain Area Dedicated To Perceiving Faces

Woman's face
Photo Credit: Katie Ricard

You are walking down a busy street in a large city and suddenly you see the face of one of your close relatives. Even if you were not expecting to see this person, and even if there are dozens, or even hundreds of people in your visual field, you will immediately recognize this as your (brother mother, sister, cousin). Not only will you recognize them immediately, you will also have an accompanying emotional response (love, hate, fear etc).

Fusiform face area — Although the visual cortex is huge and takes up a large amount of brain resources, there is a special part of the brain outside of the visual cortex whose role it is to recognize faces. It’s called the fusiform face area, or FFA (Kanwisher, 1997). This special part of the brain is also near the amygdala, which is the emotional center of the brain. This means that faces grab attention, are recognized quickly, and bypass the usual brain interpreting channels.

What do you think? Do you find you react to faces at websites? Do they grab your attention?

If you like to read the research:

Kanwisher, N., McDermott J., Chun, M. (1997). The fusiform face area: a module in human extrastriate cortex specialized for face perception. Journal of  Neuroscience, 17(11), 4302–4311.


100 Things You Should Know About People: #51 — You React To Colors Based On Your Culture

US Map with ColorsMany years ago I worked with a client who had created a color map of the different business regions for their business, showing the total revenue for the quarter for each region. Yellow was for the Eastern part of the US, green for the Central, etc. They had used red for the western states. The VP of Sales gets to the podium and starts his slide show to the financial and accounting staff of the company. Up comes the colored map. A gasp can be heard in the auditorium, and then there is the buzz of urgent conversation. The VP tries to continue his talk, but he has lost everyone’s attention. They are all talking amongst themselves. Finally someone blurts out, “What the heck is going on in the West?!” “What do you mean?”, the VP asks, “Nothing is going on. They had a great quarter”.

What does red mean? — To an accountant or financial person red is a bad thing. It means that they are losing money. The presenter had to explain that they had just picked red as a random color.

Colors have associations and meanings — Red means “in the red” or financial trouble, or it could mean danger. Green means money, or “go”. You want to pick colors carefully since they have these meanings.

Color meanings change by culture — Some colors have similar meanings everywhere, for example, gold stands for success and high quality in most cultures, but most colors have different meanings in different cultures. For example, in the US, white stands for purity and is used at weddings, but in other cultures white is the color used for death and funerals. David McCandless of Informationisbeautiful.net has a color chart that  shows how different colors are viewed by different cultures.

McCandless Color Wheel

Take-Aways:

  • Choose your colors carefully, taking into account the meaning that that color may invoke.
  • Pick a few major cultures/countries that you will be reaching with your design and check them on the cultural color chart from David McCandless to be sure you do not have some unintended color associations for that culture.

What do you think? What color meanings have you found in your work that surprised you?

100 Things You Should Know About People: #28 — Things that are close together seem to belong together

Do you want a quick and easy way to make any web page easier to use and more intuitive? If you want people to realize that two things “belong” together, then put them near each other (close proximity), and put other things a little further away. Sounds simple, right?  Many usability and user experience principles are complicated and may take significant time and energy to accomplish. This is one of the easier ones!

Let’s take a look at some web sites for examples:

In the image below of the Crutchfield page, there is a gray arrow that ends up being very close to the text on the left that says, “connect with a true audiovideo specialist”. Because that arrow is so close to the text (and actually appears to “point” to the text), the text and pictures “belong” together and become connected (as they should).

picture of Crutchfield web site

At the Global Giving website, the amount of space between text and pictures that are supposed to “go together” is about the same as the amount of space between items. This makes it less clear what text goes with what picture.

Picture of Global Giving website

In the MSNBC website the spacing between headers and photos are all even. It is not clear at a glance what headline goes with what photo.

Picture of MSNBC website

Continue reading “100 Things You Should Know About People: #28 — Things that are close together seem to belong together”

100 Things You Should Know About People: #27 — We go below the "fold"

A long web pageFor the last year or so there has been a heated debate about “the fold”. The fold is the idea that there is a place on a web page that is the bottom edge of what people will see when they look at the page in a browser, and that in order to see anything below that line, the visitor has to scroll down the page. This concept comes from newspapers — there is content on a newspaper page (especially the front page) that is below where the paper folds. In the newspaper world there has been interest for decades and maybe even centuries, at this point, about what to print right above the fold, right below the fold, and right on the fold. This concept bled over to websites in terms of what shows on the screen without scrolling.

What’s the big deal about the fold? — For many years a guiding principle of web and content design has been: If it’s important make sure it’s above the fold, because visitors may not scroll and see more. But lately marketing people, user experience professionals, and others have been questioning this principle. Certainly there is often a lot of material that is below the fold, and people seem to be clicking on it.

Want to see a visual example? — At iampaddy.com there is an interesting visual example. Here is a short video I made from the iampaddy blog that makes the point that maybe people really will scroll:

So do we worry about the fold or not? — I believe it still holds true that the most important content should be above the fold, and that if it is above the fold then it is most likely that people will see it. BUT, if it’s below the fold that doesn’t mean people WON’T see it. Ok, not a definitive answer I know, but the best we can do right now with the data we have (stay tuned… I plan to do some research of my own on this topic).

What do you think? How concerned should we be about whether information and links fall below the fold?

——————————————————————-

Did you find this post interesting? If you did, please consider doing one or more of the following:

add your comment
subscribe to the blog via RSS or email
sign up for the Brain Lady newsletter
share this post